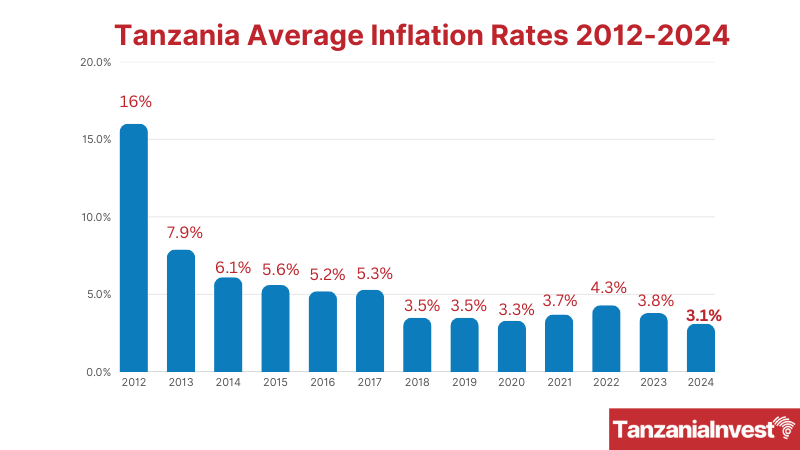
The National Bureau of Statistics of Tanzania (NBS) revealed that Tanzania’s average annual inflation rate in 2024 was 3.1%. This marks a significant drop compared to the 3.8% recorded in 2023, 4.4% in 2022, and 3.7% in 2021.
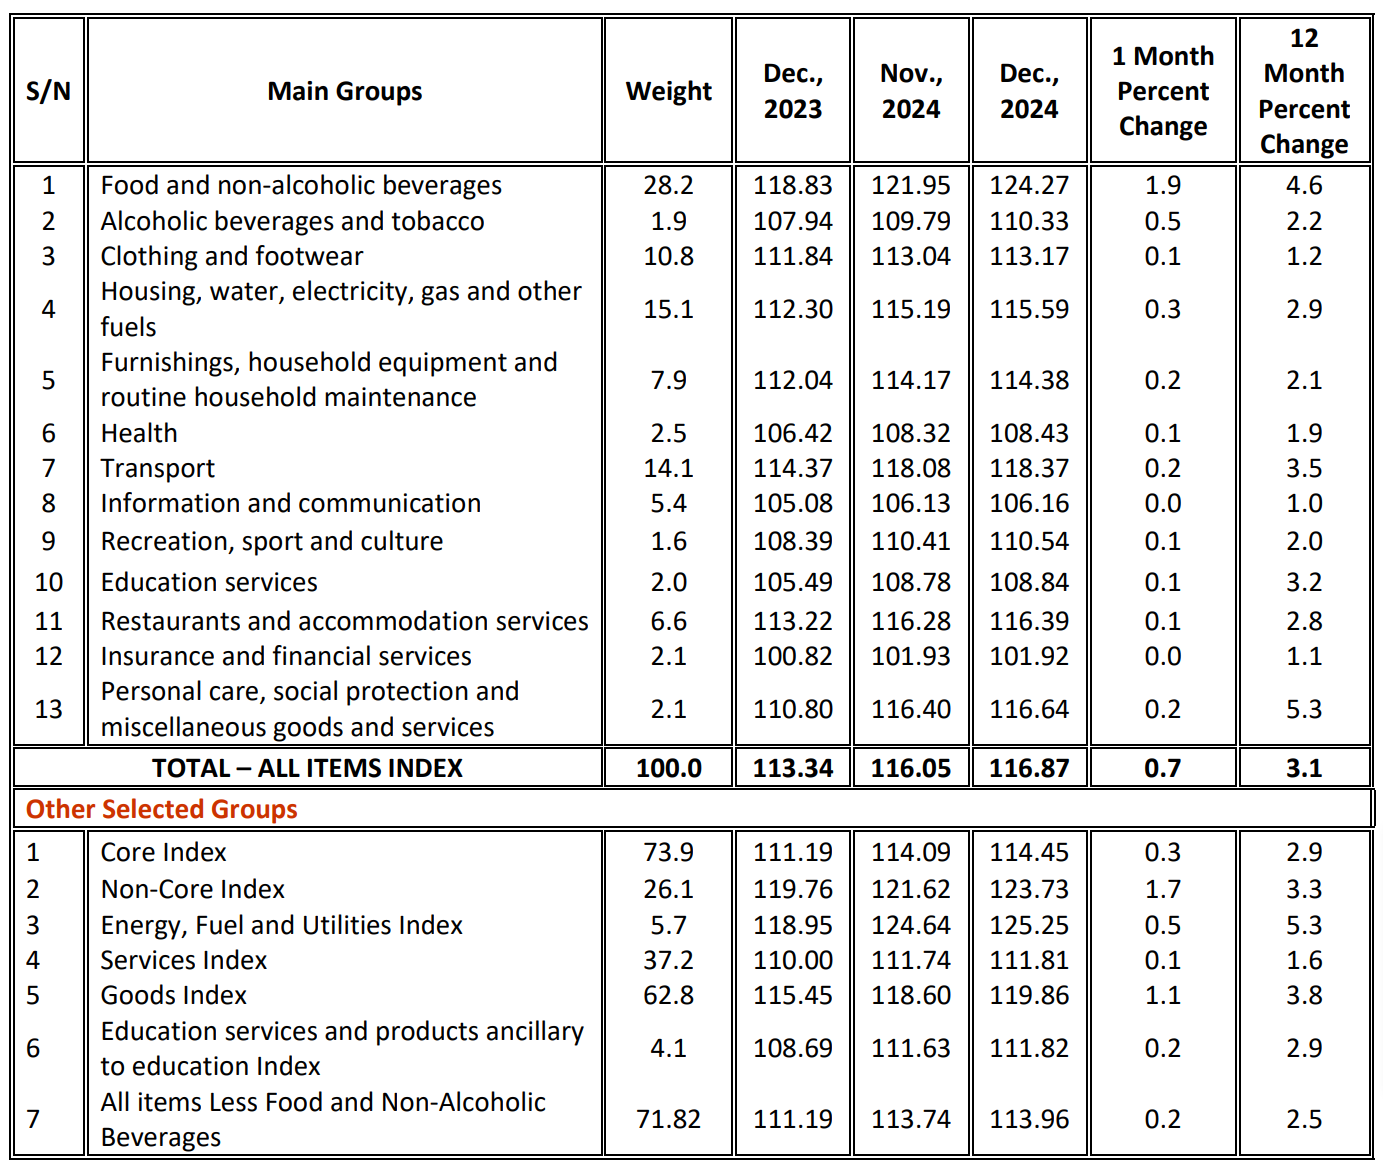
The overall index went up from 113.34 recorded in December 2023 to 116.87 in December 2024.
The decrease in the average annual headline inflation rate in 2024 is mainly contributed by the decrease in the inflation rate for food items between 2023 and 2024 since the group has the largest share (28.2%) in the CPI basket compared to other groups.

Strategic interventions carried out by the Government in the agriculture sector have resulted in increased food production, improved food supply, and enhanced availability and affordability of food.
Food Inflation
The average Food and Non-Alcoholic Beverages Inflation Rate for 2024 has decreased to 2.1% from 6.8% recorded in 2023.
Non-Food Inflation
On the other hand, the average Annual Inflation Rate for all items without food and non-alcoholic beverages for 2024 has increased to 3.5% from 2.6% recorded in 2023.
Core Inflation
Computation of the Core Index excludes items with volatile prices, such as unprocessed food, energy, and utilities, except for maize flour.
Excluding volatile prices from the total National Consumer Price Index (NCPI) provides a more stable Inflation Rate figure for policymakers.
The Core Index covers 297 items, and its share of weight in the total NCPI is 73.9%.
The Core inflation has increased to 3.4% in 2024 from 2.3 observed in 2023.
Monthly Consumer Price Index November-December 2024
The NCPI between November and December 2024 has increased by 0.7%.
The increase in the overall index is attributed to price increases for some food and non-food items.
Some food items that contributed to the increase include finger millet grains by 2.6%, maize grains by 6.9%, sorghum flour by 2.6%, bread and bakery products by 4.7%, poultry by 3.5%, beef by 6.3%, goat meat by 3.2%, pork meat by 1.4%, dried sardines by 2.4%, fruits by 2.3%, groundnuts by 2.5%, vegetables by 1.9%, round potatoes by 4.0%, sweet potatoes by 3.0%, fresh cassava by 3.5%, cocoyams by 2.3%, dried beans by 3.4%, and dried lentils by 3.4%.
Some non-food items that contributed to the increase include firewood by 1.9%, charcoal by 1.8%, and major kitchen appliances like refrigerators and cookers by 1.3%.
Changes in Tanzania National Consumer Price Indices (NCPI) for December 2024, (2020 = 100)