The Tanzania Communication Regulatory Authority (TCRA) has recently published its Communication Statistics for the quarter ending December 2024, covering telecommunication, internet, mobile money usage, among other statistics and services.
Telecom Subscriptions
TCRA reports that the total number of subscriptions grew by 7.7%, rising from 80.7 million at the end of September 2024 to 86.8 million by December 2024.
Tanzania Mobile (P2P & M2M) and fixed subscriptions Q4 2024

| Month | Mobile subscriptions | Fixed subscriptions | TOTAL |
| October 2024 | 81,937,425 | 78,134 | 82,015,559 |
| November 2024 | 84,253,866 | 78,513 | 84,332,379 |
| December 2024 | 86,769,161 | 78,299 | 86,847,460 |
Mobile Subscriptions
Mobile subscriptions represented 99.9% of all subscriptions.
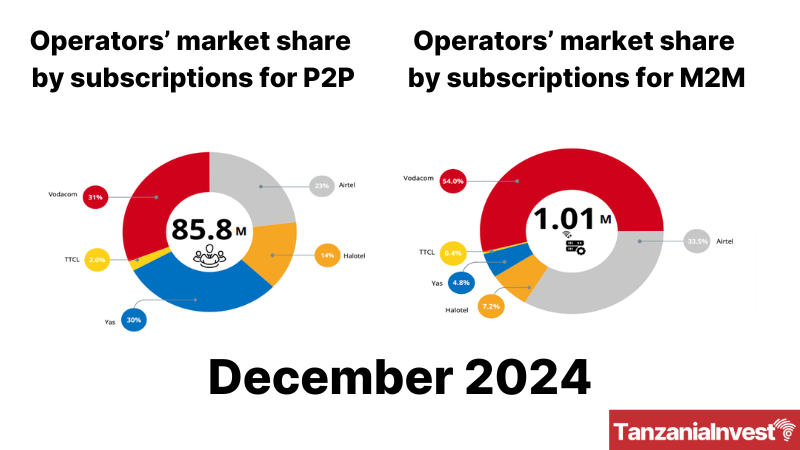
SIM card subscriptions are categorized for Person to Person (P2P) and for Machine to Machine (M2M).
Vodacom commanded the largest market share of P2P mobile subscriptions with 30.67%, followed by Yas (formerly Tigo) at 29.61%, Airtel at 23.37%, Halotel at 14.41%, and TTCL at 1.93%.
No operator in Tanzania has a market share greater than 35%, a minimum significant level for a dominant operator, indicating healthy competition among operators.
Number of P2P Subscriptions per Operator Q4 2024
| Month | Airtel | Halotel | Yas | TTCL | Vodacom | TOTAL |
| Oct-24 | 19,592,918 | 11,340,364 | 24,082,694 | 1,601,775 | 24,416,163 | 81,033,914 |
| Nov-24 | 19,835,221 | 11,779,672 | 24,716,983 | 1,621,942 | 25,323,277 | 83,277,095 |
| Dec-24 | 20,061,071 | 12,371,713 | 25,419,851 | 1,655,861 | 26,327,611 | 85,836,107 |
| Dec-24 % | 23.37% | 14.41% | 29.61% | 1.93% | 30.67% | 100.00% |
With respect to M2M (Machine-to-Machine) mobile subscriptions, Vodacom controls again the market with 53.95%. Airtel ranks second with 33.55%, followed by Halotel with 7.22%, Yas with 4.83%, and TTCL with 0.44%.
Number of M2M Subscriptions per Operator Q4 2024
| Month | Airtel | Halotel | Yas | TTCL | Vodacom | TOTAL |
| Oct-24 | 335,891 | 60,903 | 46,521 | 4,501 | 533,829 | 981,645 |
| Nov-24 | 339,039 | 71,709 | 47,435 | 4,501 | 546,079 | 1,008,763 |
| Dec-24 | 339,301 | 73,059 | 48,870 | 4,450 | 545,673 | 1,011,353 |
| Dec-24 % | 33.55% | 7.22% | 4.83% | 0.44% | 53.95% | 100.00% |
Tanzania Operators Subscriptions Market Shares – June 2024
As of December 2024, smartphone penetration increased to 35.99%, up from 33.85% in September 2024. Additionally, the penetration of feature phones rose from 84.83% in September 2024 to 87.39% in December 2024.
Mobile Money Subscriptions
Mobile Money Subscriptions
Mobile money subscriptions refer to the number of active SIM cards with mobile money service accounts that have been used at least once in the past three months.
Subscriptions increased by 3.9%, from 60.8 million accounts in the quarter ending September 2024 to 63.2 million in December 2024.
In 2024, the total number of subscriptions reached 61,882,499, a 17.03% increase compared to 2023, when the total was 52,875,129.
Mobile Money Transactions
Mobile money transactions reached 1,100,700,205 in Q4 2024, marking a 25.17% increase from 879,361,166 in Q3 2024.
However, total mobile money transactions for 2024 amounted to 378,814,358, a decrease of -29.12% compared to 5,273,086,154 in 2023.
In its report, TCRA did not disclose the value of mobile money transactions. According to the Bank of Tanzania (BOT), the total value of mobile money transaction reached TZS 154,705.77 Billion in 2023 (approximately USD 64 billion).
Tanzania Mobile Payments Indicators 2019-2023
| Particulars | 2019 | 2020 | 2021 | 2022 | 2023 |
| Mobile Money Users (Active) | 24,379,804 | 30,325,019 | 33,142,118 | 38,338,776 | 51,715,462 |
| Volume (Million) | 2,844.74 | 2,917.35 | 3,158.48 | 3,595.04 | 5,061.20 |
| Value (TZS Billion) | 94,597.64 | 109,214.30 | 115,228.42 | 114,315.99 | 154,705.77 |
| Value YOY Growth % | 15.45% | 5.51% | -0.79% | 35.33% |
Source: BOT 2023 Annual Report National Payment Systems
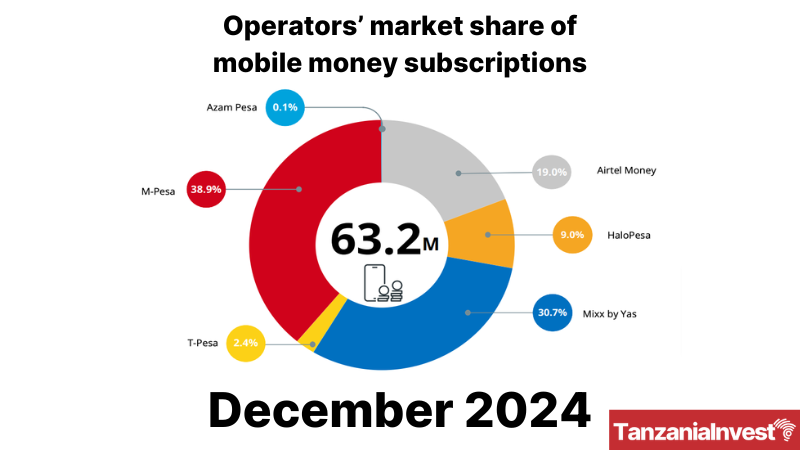
Tanzania Mobile Money Operators Market Share – December 2024
The mobile money market is very competitive as Mixx by Yas (formerly Tigo Pesa), M-Pesa, and Airtel money control around 89% of the market share by subscription, led by M-Pesa with 39.8% market share.
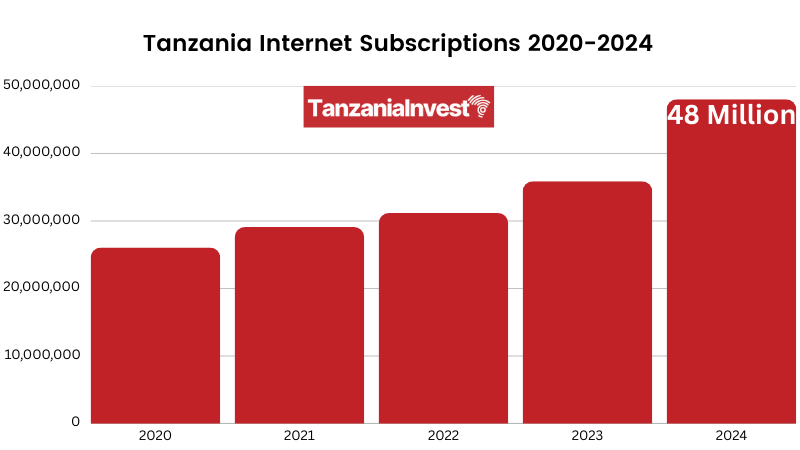
Internet Subscriptions
As of December 2024, there were 48,028,227 internet subscriptions, representing an increase of 16.07% from 41,376,545 in September 2024 and a 33.83% rise from 35,885,592 in December 2023.
Mobile wireless is the most preferred internet service compared to others. As of December 2024, it accounted for 99.6% of all subscriptions.